IoT Analytics for a Biotech Manufacturing Operation
CorrDyn built machine monitoring pipelines, ML failure detection, and real-time Grafana dashboards for a global biotech DNA/RNA synthesis manufacturer.
Significant reduction, completed Jan 2025, freed budget for new initiatives
AWS infrastructure costs
Real-time dashboards across synthesis benches, from no visibility to per-machine and per-barcode detail
Machine observability
ML models and automated alerting deployed across plate loading, sample preparation, and reagent consumption workflows
Failure detection
The situation
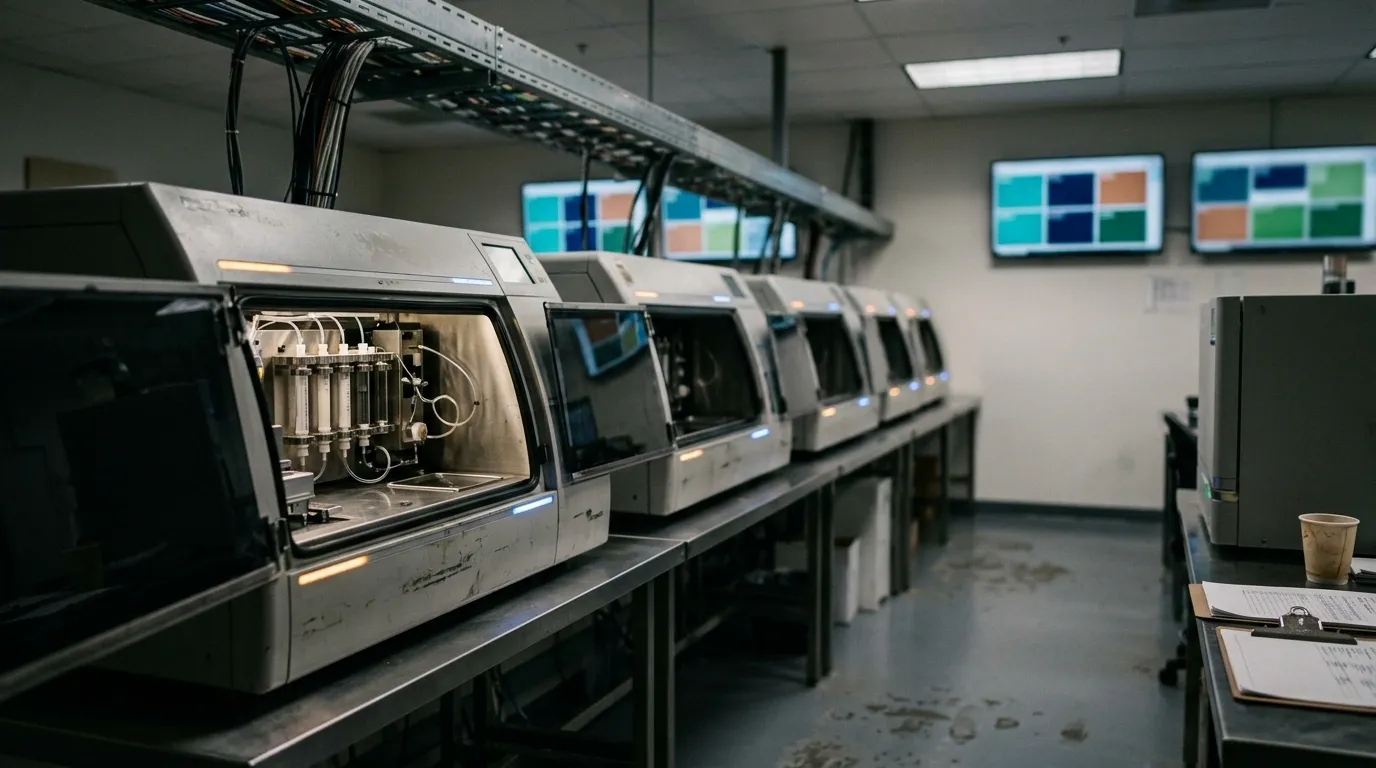
A global biotech manufacturer produces DNA and RNA synthesis products at scale. Their synthesis machines generate continuous streams of state data: bench status, process transitions, error codes, and reagent consumption readings. But none of that data reached anyone who could act on it. Engineers knew machines were failing only when production stopped. Downtime root causes were reconstructed after the fact, if at all. There was no way to compare bench performance across the floor or identify which process parameters were associated with errors.
The data existed. It was locked inside PLCs and OPC servers, in formats designed for machine control, not for analysis.
What we built
CorrDyn built a data engineering pipeline that starts at the machine layer. PLC and OPC signals feed into AWS Kinesis, where event streams are ingested in real time. Databricks processes those streams, applying PackML state parsing to turn raw machine signals into structured process records: which bench, which synthesis run, which state transition, when, and for how long.
On top of that foundation, we built a Grafana monitoring and analytics layer that gives engineers real-time and historical visibility into every machine. A real-time status view shows current bench state across the floor. Deeper drill-down views provide machine-level and barcode-level detail for investigation. Engineers can filter by membrane type, bench, date range, and synthesis process without writing a query.
We built ML models for failure detection and anomaly identification, applying both image analysis and time-series methods to manufacturing signals. A plate loading error analysis correlates error rates with membrane type and load parameters, giving process engineers a clear target for reducing a class of failures that had been treated as random variation. A sample preparation model was taken from prototype to production-grade deployment with monitoring and alerting attached.
The engagement has also included a data infrastructure assessment and roadmap, AWS cost optimization work, Grafana usage analytics, and downtime analysis for change-outs. Each initiative connects back to the same core pipeline.
What changed
Engineers now see machine behavior in real time and can investigate historical patterns without pulling data manually. Failure investigations that previously required days of log reconstruction happen in minutes using the dashboards. The plate loading analysis identified actionable correlations that process engineers are using to reduce errors by membrane type.
The AWS cost reduction work, completed in early 2025, produced savings material enough to reallocate budget toward new analytics initiatives. The platform continues to grow. New dashboards, new ML models, and new data sources get added on a regular cadence because the underlying pipeline is stable enough to build on.
The engagement has spanned years and more than two dozen statements of work because manufacturing data problems do not resolve in a single project. Each answer tends to surface the next question.
Frequently Asked
Questions
Our synthesis machines generate data but engineers only find out about failures after production stops. Can we get ahead of that?
How do you get analytics data out of PLCs and OPC servers that were designed for machine control, not reporting?
This sounds like a large, ongoing engagement. How does CorrDyn scope and price something like that?
Related Work
Similar engagements across our portfolio.
Manufacturing Throughput Optimization for a Biotech Producer
CorrDyn built process time analytics and a batch production simulation for a biotech manufacturer, enabling data-driven throughput optimization.
ML-Powered Failure Detection for a Diagnostics Manufacturer
CorrDyn designed data pipeline and ML model-serving infrastructure for a diagnostics manufacturer to catch cartridge failures before quality control.
ML Customer Segmentation for an Automotive Dealer Group
CorrDyn built an ML clustering pipeline on Databricks with LLM-powered profiling to segment customers across vehicle brands for a dealer group.
Related Conversations
Podcast episodes that cover the same ground.
Applying ML/AI to Drug Development with Anil Kane
with Dr. Anil Kane, Thermo Fisher Scientific
Dr. Anil Kane of Thermo Fisher Scientific discusses how AI, machine learning, and digital tools are reshaping drug development and manufacturing efficiency.
Machine Learning and Quality Control in Biotech Manufacturing
with James Winegar, CorrDyn
James Winegar, CEO of CorrDyn, on applying machine learning to quality control workflows in biotech manufacturing and unlocking operational data.
Physics, Free Energy, and Computational Drug Discovery
with Robert Abel, Schrödinger
Robert Abel of Schrödinger on why ML alone fails in 10^60 chemical space and how physics-based simulation reaches near-experimental accuracy.