




















Blog
117 Key Questions for E-Commerce Leaders
117 questions e-commerce leaders should answer across finance, marketing, sales, operations, support, technology, and BI — prioritized by business impact.
By Ross KatzRead
We build analytics platforms that put the right numbers in front of the right people and make sure those numbers are correct.
Business intelligence is not about dashboards. It is about enabling your organization to make better decisions faster by putting the right information in front of the right people at the right time.
300+
Dashboards and reports delivered across all clients
87%
Annual revenue growth at an EdTech client after gaining data visibility
18
Department heads with unified real-time dashboards at a single client
Engagements where this is the right work.
Give leadership a real-time view of the metrics that matter without waiting for someone to pull a report.
When finance says one thing and ops says another, the issue is almost never the people. It is the data model. We fix the model so every team sees the same truth.
Stop making your analysts the bottleneck. We build governed, self-service environments where business users can answer their own questions safely.
Define your metrics once in dbt, LookML, or Omni and reuse them everywhere. No more spreadsheet definitions that contradict the dashboard.
Build data into your product. We develop the infrastructure that lets your customers or external stakeholders see their own data through dashboards and reports embedded in your application.
A structured approach that delivers results at every stage.
CorrDyn's BI practice starts with understanding your organization's decision-making processes, not your data. We map out who makes which decisions, what information they need, and how they currently get it. Then we design BI solutions that fit naturally into those workflows rather than creating yet another tool people have to check.
Output: Decision inventory with metric owners and refresh cadence
We build self-service analytics platforms that let business users explore data independently, executive dashboards that surface key metrics without noise, operational reports that drive daily action, and embedded analytics for customers and external stakeholders. Every deliverable includes documentation, training, and a governance framework so your team can maintain and extend the platform after our engagement ends.
From our podcasts: Unlocking the Power of Semantic BI with Hashboard, From Pipelines to People: Building Data Teams with Lindsay Murphy, and Enhancing Developer Efficiency with SQLMesh.
Output: Production dashboards, semantic layer, and a hands-on training session
Great BI starts with great data modeling. We implement semantic layers using tools like dbt, Looker's LookML, and Omni that create a single source of truth for business metrics. This eliminates the "my numbers don't match yours" problem and ensures everyone in the organization is working from the same definitions. See how we built a BI platform for a healthcare ecommerce company and optimized data operations for a trade association.
Output: Metric catalog with definitions, owners, and approval workflow
Perspectives from our team on business intelligence.
117 questions e-commerce leaders should answer across finance, marketing, sales, operations, support, technology, and BI — prioritized by business impact.
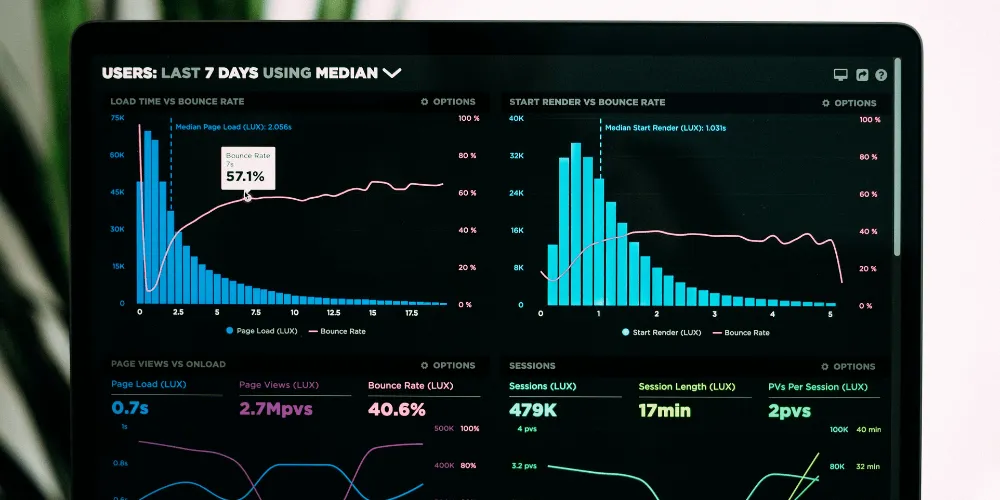
How data availability, actionability, and credibility determine whether your organization captures value from its data investments.
Real outcomes from real engagements.

Enterprise Technology

Healthcare / Home Care Services

Automotive / Retail
Your team deserves numbers they can act on. Let’s figure out what’s broken and build something they’ll actually use.
Book an Intro CallOr, see what else we do.

Build reliable, cost-effective data pipelines on AWS, GCP, and Azure. CorrDyn designs and implements data infrastructure that scales.

Fix the trust problem in your data. CorrDyn implements testing, validation, governance frameworks, and metric definitions your organization can maintain.

Connect marketing spend to revenue. CorrDyn builds attribution models, customer segmentation, marketing mix models, and ROI reporting across channels.

Get a full data team without the hiring timeline. CorrDyn embeds the specific skill sets you need and owns outcomes, not just hours.