Listen on
Overview
Biopharma companies face immense pressure to accelerate drug discovery and identify new therapeutic targets. The core challenge isn’t a lack of data, but how to effectively synthesize insights from a vast and rapidly changing universe of scientific literature, clinical trials, and internal research. Traditional database queries and manual reviews often fail to provide the speed and depth needed to de-risk development and stay competitive.
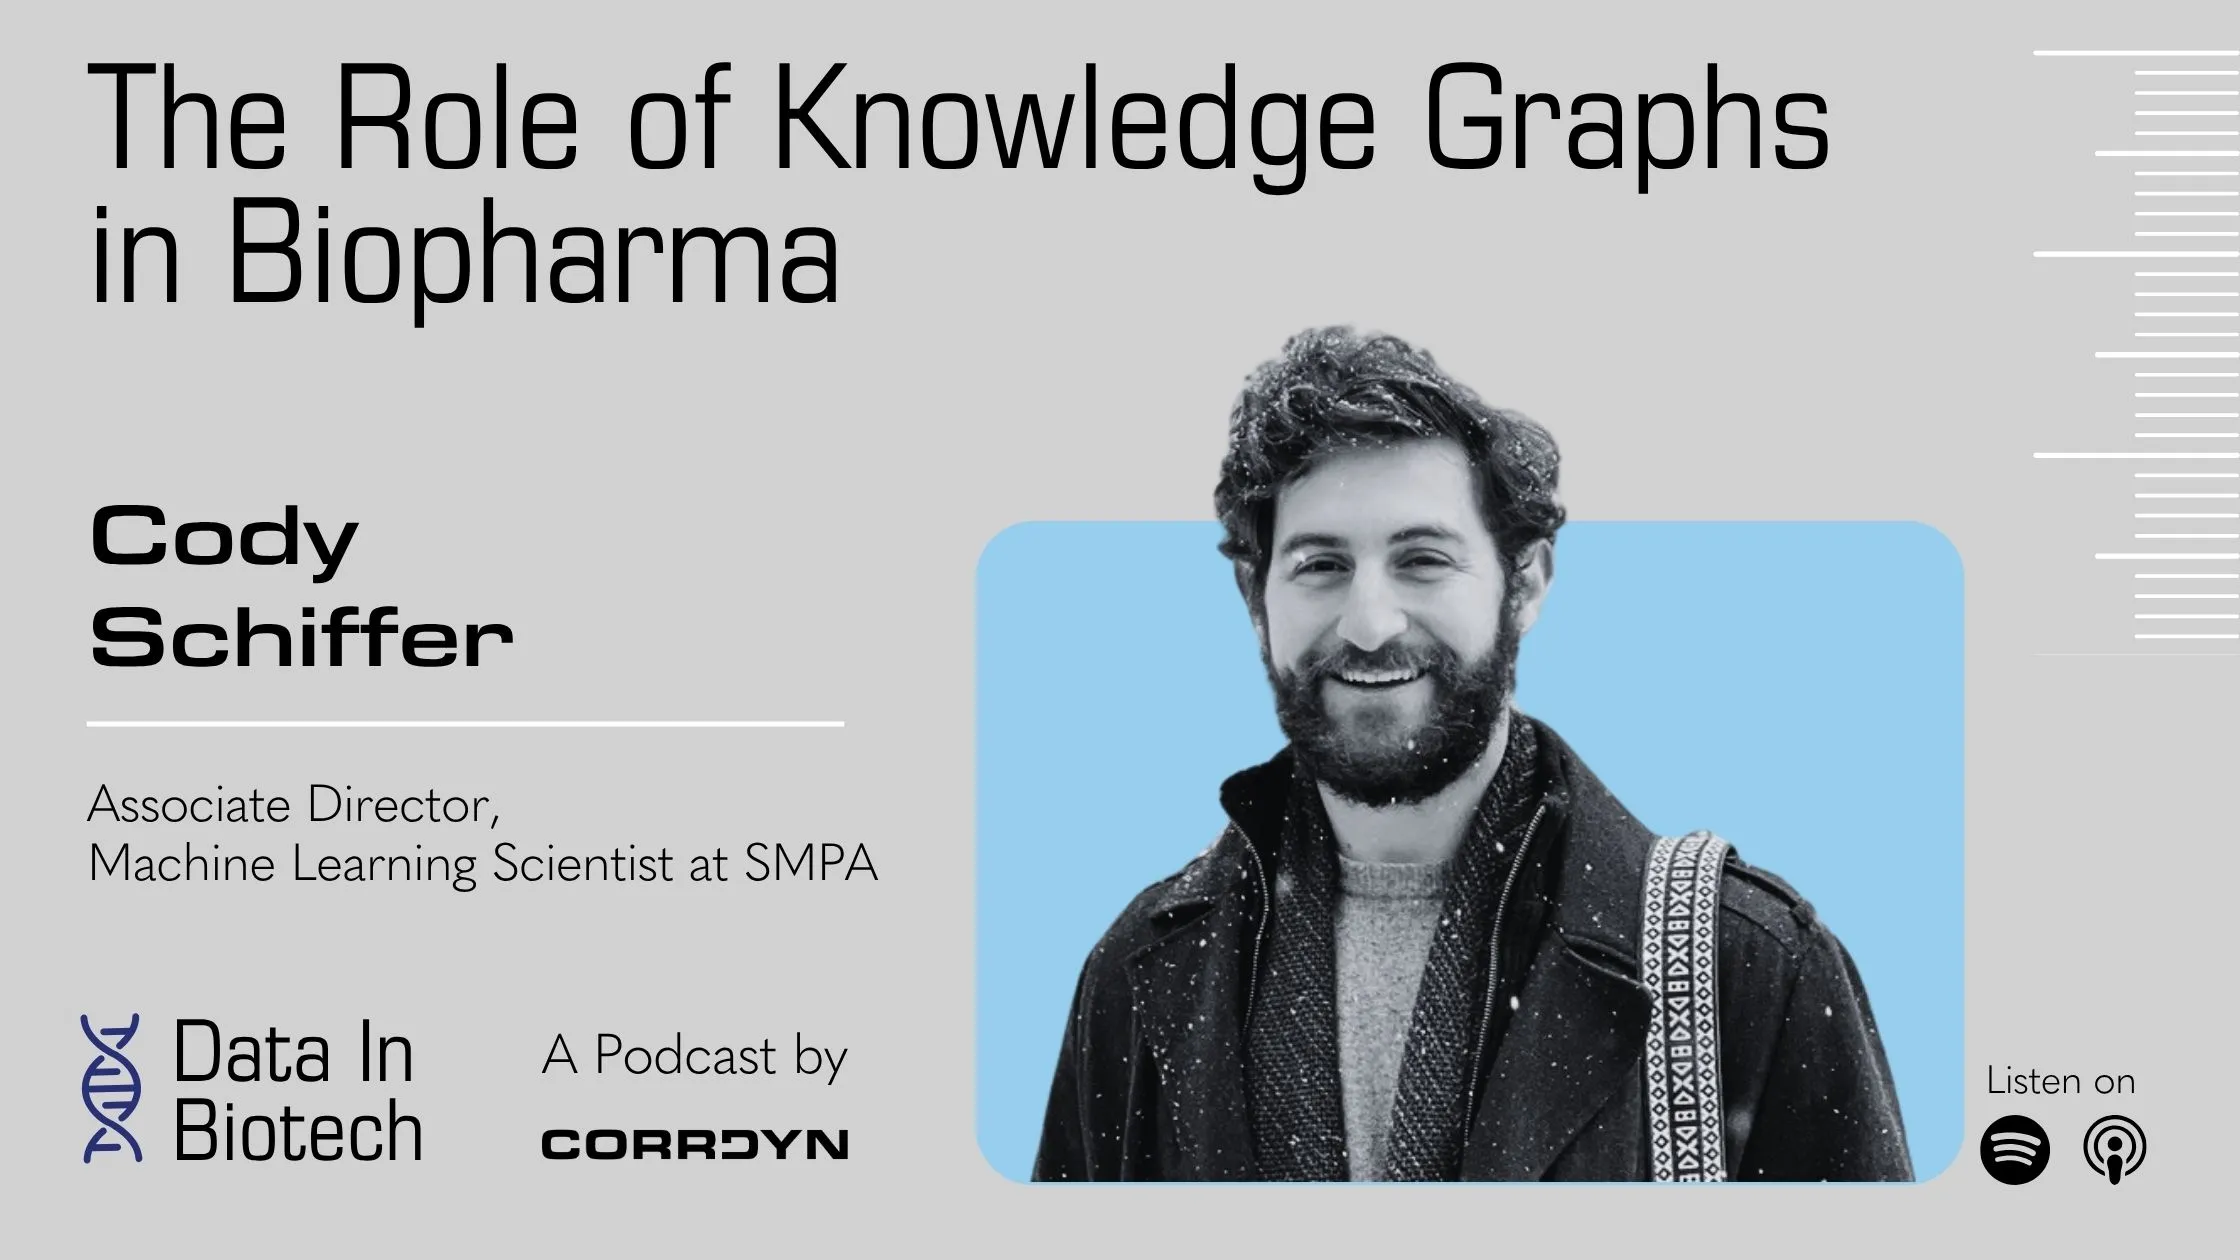
In this episode, host Ross Katz speaks with Cody Schiffer, Associate Director of Machine Learning at Sumitomo Pharma America. With a background spanning biology, biomedical engineering, and machine learning, Cody brings a rare perspective to building computational methods that directly address these R&D challenges. He explains how his team constructs and maintains knowledge graphs to integrate disparate structured and unstructured data sources, moving beyond simple keyword searches to reveal novel connections between diseases, targets, and treatments.
Cody details the practicalities of populating these graphs using public ontologies and advanced natural language processing with large language models, alongside the critical task of entity normalization. The conversation also covers the challenges of keeping these graphs current with real-time information, developing intuitive interfaces for scientists, and the strategic decisions around building internal data capabilities versus acquiring external tools.
Key Takeaways
Data Science Impact Hinges on User Interaction, Not Just Model Accuracy
Building complex analytical models, especially knowledge graphs, is only half the battle. Presenting insights in an intuitive way, such as custom front-ends that allow non-technical scientists to explore connections and provide feedback, is often more critical than the underlying technical sophistication. Without effective delivery, even accurate models fail to drive business value.
Effective Knowledge Graphs Demand Continuous Schema and Data Experimentation
Simply ingesting public ontologies into a graph provides limited value. True impact comes from customizing relationships, experimenting with different data inclusions and exclusions, and adapting graph schemas to specific analytical tasks. This iterative approach, guided by human annotation and business use cases, ensures the graph yields the most relevant insights.
Domain-Specific LLMs and Internal Benchmarks Validate Graph-Based Insights
While large language models accelerate unstructured data extraction for knowledge graphs, generic models fall short in specialized fields like biopharma. Fine-tuning LLMs with domain expertise and establishing internal, task-specific benchmarks are essential steps. These benchmarks, coupled with scientist annotations, ensure the extracted information is accurate and reliable for downstream analysis, counteracting the opaque nature of some AI tools.
Ensure Reproducibility by Freezing Knowledge Graphs for Analysis
Knowledge graphs in biopharma are constantly updated with new research and real-time information. This dynamic nature creates a reproducibility challenge for analytical results. To compare analyses effectively and ensure consistent findings, teams must implement processes to “freeze” graph versions at specific points in time, much like version control for code, allowing for historical comparisons and consistent benchmarking.
Related: CorrDyn provides data engineering services for companies in biotech and life sciences. We also help clients define their AI strategy and ensure data quality in complex systems.
Full Transcript
Jason: Welcome to Data in Biotech, a podcast from CorrDyn where we explore how companies leverage data to drive innovation in life sciences. Every two weeks we sit down with an expert from the world of biotechnology to understand how they’re using data science to solve technical challenges, streamline operations, and further innovation in their business. This week, we’re excited to be joined by Cody Schiffer, associate director of machine learning at SMPA, a biopharmaceutical company focused on delivering therapeutic and scientific breakthroughs in areas of critical patient need in psychiatry, neurology, oncology, urology, women’s health, rare disease, and cell and gene therapies. During this conversation, Cody and Ross discuss the construction, maintenance, and application of a knowledge graph in biopharma, including how to integrate structured and unstructured data to support tasks like literature searches, competitive intelligence, and drug discovery. They also discuss the challenges of keeping a knowledge graph updated with new real-time information. Before we get into the episode itself, it’s also worth noting that at around the seven minute mark we had a small technical difficulty and had to move studios, so the audio from that point sounds a little different to the audio at the start. But trust me, the content in the first half is just as good as the second. Here we go.
Ross Katz: Cody Schiffer, welcome to the Data in Biotech podcast.
Cody Schiffer: Hi, thank you for having me.
Ross Katz: Awesome. Just to kick us off, would you give us a brief overview of your career to date?
Cody Schiffer: Sure. I am a formally trained biologist in biomedical engineering. I did my undergrad and graduate work at Northwestern University. My first job out of school was actually working at Nielsen Holdings, but I made that switch in February of 2019 and moved to New York to work in the biopharma space, first with Roivant, then with Sumitovant Biopharma, and now Sumitomo Pharma America. I have progressed from primarily a data engineer to now a machine learning scientist and I now lead a team of engineers at SMPA.
Ross Katz: Awesome. Why do you do what you do? What motivated you to get into the field that you’re in now?
Cody Schiffer: I’ve always been passionate about healthcare and, much to my Nana’s disappointment, I did not end up being a physician. In college when I completed my graduate work I recognized that I was more interested in research and that I was better at asking questions than always answering them. I saw that the future of medical development, whether it was medical devices or pharmaceuticals, really revolved around computational methods, whether that’s data science in particular or leveraging more advanced computing, better leveraging software development and engineering. Just computer science as a whole. When I graduated college I tried to get into that more and to leverage my experience as a research scientist and my stats background to get into data science cause I saw that really integrating more closely with the medical development field.
Ross Katz: My understanding is that Sumitomo Pharma has supported FDA approved products and also has a robust pipeline of investigational assets that you’re working on. Can you give us a quick overview of how data science and computational methods contribute to the work that you do, and in particular what kind of work you and your team are supporting?
Cody Schiffer: Absolutely. You’re correct. SMPA has assets that are currently commercialized, such as for overactive bladder disorder and for some women’s health challenges such as endometriosis and uterine fibroids. We also have investigational assets, some in the more gene therapy area. And then we have things that you probably haven’t seen that are labeled as investigational but are very early stage clinical. Data science in one form or another touches this entire spectrum. That’s really the exciting part. I specifically work on what we call the ACTER team, which is the Advanced Analytics and Clinical Trials Research Division. Within that I work on the Computational Research and Methods team, and we focus on leveraging artificial intelligence, deep learning, and cutting edge developments in graph science and natural language processing to assist from early stage asset identification and drug development research to late stage commercialization efforts. Some examples of things that we focus on as a team include helping scientists such as clinicians or MDs, geneticists, better understand the target scape for a specific disease. We’ve also executed KOL analyses, or key opinion leader analyses and identification for our commercialized assets, and we leverage data science in a broad capacity for competitive intelligence. That can be used for early stage asset identification, but it can also be used to monitor for job migrations for key opinion leader analysis or for understanding the latest regulatory developments. It’s really everything from helping business development professionals scout out licensing deals to helping geneticists really understand what is going on in a pathway to better understand the method of action.
Ross Katz: That’s really interesting and such a broad scope of activities that you’re supporting. What are the threads that bind these things together? Do you have individuals on your team assigned to stakeholders or are you all working on a single platform or small set of platforms that support all of these use cases?
Cody Schiffer: This is something that actually is not considered frequently enough in data science and particularly in biotech. Oftentimes people just hire some data scientists or people that know how to cobble together a model and then they’re just like go and answer questions. That doesn’t really help. I think that the way that SMPA organize their data science research and development divisions is pretty efficacious. We operate as an internal consulting group. We have stakeholders which can be individuals or entire organizations and they come to us with questions and then each member of the team will coordinate that research effort with that stakeholder. For instance, myself, I work with individuals from manufacturing and sourcing. I also work with geneticists from Japan and I’m responsible for managing each one of my projects. But that’s because I’m a team lead. My team specifically focuses on the advanced analytics, that’s large language models and the fun data sciencey stuff we’re talking, but there is also a very important arm of the ACTER team which is focused on clinical trials. They are frequently working with regulatory professionals and other people involved in pricing to conduct claims analyses and better understand market penetration for certain assets, how well commercialization is going for our own assets, and frequently collaborate with sales teams. While my team is focused on these advanced analytics, the clinical trials data and claims analysis focused data teams are just as instrumental for SMPA.
Ross Katz: Let’s take the use case of helping scientists better understand the literature and development of research and sort of the target scape that’s out there. How do you approach it?
Cody Schiffer: I should say one additional thing before I get started is our team is also responsible for internal development. Like any good R&D team, we have to be somewhat proactive in coming up with tools that answer some of our scientists’ questions or some of our clinicians’ questions. I’m glad you actually chose the literature search and target scape question cause that is exactly what happened there. A team came to us with a question about a neurological disorder. SMPA is broadly interested in CNS disorders as well as psychiatric disorders due to work with what was formerly Sunovion as well as other assets. What happened here was we had somebody from the former Sunovion organization ask us questions about this neurological disorder and effectively their question was can you help provide a summary of the scientific literature for a particular target in here? Which is asking, if you do a keyword search against your entire database of scientific literature, can you tell us which papers are important and rank them? The next question that we have is okay, what determines an important paper? What are additional features to identify within papers that may make them relevant to the target or may make them irrelevant to the target? This is slightly different than the feature selection. Because features is how we rank the paper, but first we have to be able to find them. If they ask for one target, the question is, are there other targets that are related to this protein within the context of a pathway that may be also of interest for this team even if they did not specifically ask for it? We do all of that research first. We start looking at synonyms for targets. We start looking at which sources of scientific literature may be most appropriate. We start looking at which ways to rank papers. Then we put together a first project plan for this. Then we go back to our team, the initial stakeholder, and usually within the scope of a week to three weeks depending on their timelines and how complex their literature search is, we propose our process. Usually a proof of concept. We would have a smattering of literature for them to review, and we would get their feedback and if necessary tinker our method. After that we would execute the literature search, use our ranking algorithms and information extraction pipelines to not only rank the material but also extract critical insights from the paper, in effect, summarize the literature for them so that they don’t have to necessarily read each abstract to know exactly what’s going on but they can get a high level overview of what’s going on from an Excel sheet. Which is a much more condensed version of potentially hundreds of papers versus having to actually read a hundred abstracts. That’s really part one, which is the quantitative side. Can revolve around deep learning methods, will revolve around text searches one way or another, will be doing database searches against a knowledge graph perhaps or against our internal data lake of literature. That summarizes part one. Now we go to part two, which is what is the most effective way to actually convey this information? This is something that I didn’t necessarily appreciate as important until I actually started working in biopharma, and in a small company. We don’t necessarily have a lot of hands between people who work on data science and the people who are working either as clinicians or scientists who may not be as advanced with data or as familiar with data science. The portrayal and delivery of results is just as important if not more important in my experience than part one. I think that this is a common thread across data science in particular, and we have faced this with our knowledge graph work, we have faced this with our literature search work. One of the efforts my team and I are making is to provide intuitive and easier ways for people to explore the results that we deliver them. We’ve constructed front ends for this that support better understanding the information extracted from papers as well as looking at better methods for summarizing our findings from research for the literature search. We actually put together a front end that allows people to investigate the target scape for that particular neurological disorder. We found all of the nodes and edges that relate to every target about a specific disease, we created a subset of that graph and then we put it into a front end that we constructed ourselves that allows people to execute specific topological graph algorithms like, what’s the shortest path between this target and this target? That can be another intuitive way to explore literature. Because if you can see the shortest path between two diseases, or two targets, you can also see which papers relate to them. All of a sudden you have novel connections that are visualized.
Ross Katz: That’s super interesting. It sounds like you have a knowledge graph that aids you in the literature search problem, but also I’m imagining aids you in some of the other problems that you’re solving across the organization. Can you give me a sense of how that knowledge graph is constructed and how you keep it updated over time?
Cody Schiffer: Within the knowledge graph there are structured and unstructured data sources. Structured data sources can be things from ChEMBL or Reactome or disease ontology. These are data sources that have some degree of annotation but really have a degree of organization that comes from other professionals. Let’s take disease ontology for instance. This is a hierarchical organization of diseases according to physicians. You see how diseases are related to each other because they’re grouped within branches. It’s broadly organized by organ system at times, but also there is overlap. You see sex hormone sensitive cancers appearing in diseases of cell proliferation, just overgrowth of cells which would be cancer, but also in reproductive disorders, especially for things like ovarian cancer. That’s structured data. We take that hierarchy and it’s very easy to see okay, prostate cancer is a disease of the male reproductive system and then that relates to a disease of cell proliferation. All of a sudden we can reflect that in a triple in the knowledge graph very easily. Same thing can go for Reactome where you represent target one in a gene pathway to an entire complex of proteins. That’s a very simple triple. When I say simple, it’s simple for us to understand, but actually ingesting it into the knowledge graph is quite difficult. Cause there’s all sorts of problems with entity normalization. If we have conflicting disease labels from different ontologies, it’s alright, which one do we choose? We have methods for dealing with that as well and some of them rely on natural language processing.
Ross Katz: It sounds like you’re using a lot of the public ontologies that are out there and combining them together and doing this entity normalization and creating your own clean version of the knowledge graph that represents a customized version of the different knowledge graphs that are out there. Am I thinking about that right or how do you approach it?
Cody Schiffer: Yes, I think that is an appropriate way to look at the structured data. The key is customization. I do not have the professional background to argue against the grouping of disease ontologies for physicians, because physicians put that together. It’s very helpful for them to understand diseases as they’re organized by organ systems. But the key thing is that that may not be the most effective way to look at how diseases are related. Even if cystic fibrosis and sickle cell anemia affect two very different body systems and have a wide difference in prescribed treatment, demographics affected, the fact that they’re genetic disorders may be something that’s more important to us to evaluate. That’s where we start tinkering with okay, we have this information, what is the best way to represent it in the graph? We have the normalization task and we have the structuring task for structured data. Then we have the much broader and much more difficult problem of then marrying that to an entirely new suite of unstructured data. Some of these normalization tasks utilize natural language processing. The front end that I previously mentioned for that target scape also allows individuals to annotate our graph, which is a particularly powerful way of trying to get input from medical professionals that have greater context than computer science focused individuals. What I have often found is that it is best for data scientists to really embed themselves within the business case or to align themselves with stakeholders who understand the broader business use case for what they’re developing. I think this is just a question of job priority and job focus. In my opinion, a house divided unto itself cannot stand. If you have clinicians totally separated from the data scientists who are working to conduct the analyses that the clinicians or business development people want to review, then there’s no guarantee that what the data scientists are doing or what the computational teams are doing are actually answering the question effectively or perhaps even structuring the data to allow questions to be answered that need to be answered.
Jason: Are you a biotechnology company looking to unlock the potential of your business data? CorrDyn can help. We’re an enterprise data specialist that helps companies working in life sciences make smarter, strategic decisions. From developing the right data strategy that starts with our data maturity assessment, to building and delivering bespoke technical solutions, we are equipped to tackle the most complex data challenges. We have partnered with dozens of high-growth organizations from manufacturers of custom oligonucleotides to molecular diagnostics companies to achieve data competency. Whether you need to supplement existing technology teams with specialist expertise or launch a data program that lays the groundwork for future internal hires, you can partner with CorrDyn to unlock the potential of your business data today. Simply visit connect.corrdyn.com/biotech to learn more. Now, back to the show.
Ross Katz: Before I diverted you I’d love to return to the unstructured data and how you incorporate that information to the knowledge graph. Interested in how you think about it and the methods you apply.
Cody Schiffer: I think it’s great that you actually brought up large language models. The advent of large language models from GPT to Llama, really this whole cohort have in my opinion accelerated our ability to integrate unstructured data into our knowledge graph. Previously setting up information extraction pipelines for specific entities such as proteins or drugs or companies were much more laborious. Generative AI tools have allowed us to be more flexible and to more quickly spin up information extraction pipelines that can be later fine tuned. We have largely been able to accomplish the links between structured and unstructured data sources with some large language models but also dictionaries. We haven’t faced as much issue there or spent as much time there because we just set up these IE pipelines to work on unstructured data sources and they’ve shown some really great abilities to normalize entities, which is helpful.
Ross Katz: The process that I have in mind is you have all of this unstructured text getting passed through an LLM and your prompting of the LLM is asking it to output the format that you want these things to be in and you give it some examples of the type of data that you want to see out of it and it’s generating candidates for these relationships that you’re integrating into the knowledge graph. Is that baseline of how it works on the right track? And secondly, what do you do with the candidates once you have them? How do you decide what to integrate into the graph, where to integrate it into the graph, that sort of problem.
Cody Schiffer: You’re almost correct, but there is a critical step here which is not all large language models are equipped to handle biomedical data. We saw this before the advent of LLMs where we saw things like BERT, which was really important in the field of natural language processing. It wasn’t great with biomedical data. But then something came out called BioBERT which was BERT but specifically fine tuned and trained for the biomedical field. What we’re starting to see is whether it’s companies and cells using internal efforts to fine tune large language models or use their own large language models or people working with external groups to create a version of a large language model that’s specific for their needs, which I think reflects a broader trend. I should also mention that we don’t just rely on LLMs for these information extraction pipelines. We have other internal methods that our AI scientists, like my colleague Carson, have done a really great job of setting up so that we can not only rely on open source materials. To your second question of what do we do and how do we structure for that, that is right now a process of experimentation. It’s a little bit of a chicken and the egg problem because we’re trying a schema or an organization and we’re saying okay how does it affect the output? Because we have a curated selection of material that has been relevant, which is very helpful. If we take a look at material that has been kept or ignored for a specific reason or look at the reasons for why something was kept, we can evaluate how well different graph structures work with different graph analysis. One schema may not be the best for every task.
Ross Katz: There’s a way in which it’s not a knowledge graph that you’re maintaining, it is a bunch of data in graph format where you’re including and excluding the specific types of entities and relationships that are relevant to the task at hand and then trying to get signal about the output that you care about, whether it be research papers that are relevant to a particular target or pathway or whether it be competitive intelligence that’s relevant to the questions that your stakeholders in that arena are asking. You’re experimenting with inclusion and exclusion of data but then also graph structures that are going to provide the most amount of signal about those outputs. Is that right?
Cody Schiffer: Yes, that’s a great way to look at it.
Ross Katz: Another thought I had as you were talking is that you’re processing all of this unstructured information that you’re gathering through these different sources and, especially in biotech where there’s this reproducibility crisis, you find an academic paper that claims that there is a relationship between this drug and this target or a set of relationships that are there. How do you approach the weight that you apply to the information that you’re gathering? Are you weighting information that you see more frequently heavier? And also do you view it as even your place to apply those kinds of weights when it might be the role of the scientist to look at these relationships and validate or invalidate that they’re there?
Cody Schiffer: To answer your latter question first, the answer is no, I don’t believe it’s my place. That’s why we built that front end. So people can provide annotations. We actually built two versions of this, one that takes a look at a subset of relationships between any two entities and allows people to rank them within this smaller universe, which is able to provide relative weights within a subsection of the graph. And then we also provided another method which is we provided this front end that scientists can use and they can look at this whole front end and they can be alright, this relationship is correct, this one is not, this one should be weighted higher, lower. There will always be a sample size issue. We cannot ask scientists to annotate the entire graph. But with graphs, both known relationships and unknown relationships are used in any analytical process, especially in tasks like link prediction. Any annotation and weighting from scientists in my opinion is good, especially at the stage when graphs’ use cases are still being explored. At this point it’s not really affecting the weights because the weights are more empirically derived at this point. We’re working on different methods of weighting different relationships to see how they affect our graph analysis algorithms, whether it’s a GNN or a much more simple in-house Neo4j topological model for link prediction. We’re seeing how the results compare to our annotations for competitive intelligence that should be kept or removed. But for the first task of determining how right something is, that’s difficult. And with large language models, they are a bit of a black box even if they are fine tuned. We’ll take them as case study point for our information extraction pipelines, we’ve put together corpuses of triples that myself or other people have extracted that can serve as a baseline or perhaps a standardized testing set that people can compare different prompt engineering attempts, different in-house NLP methods for information extraction, and they can see how they perform against somebody who may not be a biologist at the company but somebody who is still equipped to conduct information extraction. I can leverage my experience as a biologist and a biomedical engineer to put together a dataset that can then be used for evaluating the performance of large language models to extract material that is not only properly structured for the graph but is also intelligently extracted.
Ross Katz: That makes a lot of sense and that’s in alignment with a lot of the problems that I hear engineers talk about with regard to LLMs, which is that if you don’t have a benchmark that’s applicable to your task that you feel confident in then you’re always flying blind and just experimenting without really knowing whether you’re making progress toward your end goal. It sounds like developing and maintaining that internal set of benchmarks is critical for you as you experiment with these different tools and the different LLMs that come out.
Cody Schiffer: Exactly. There’s also this great website Papers with Code which will frequently publish new research from specific papers along with the actual code behind them and then sometimes you can actually get access to their benchmarks. It’s not always internal and this reproducibility crisis that you mentioned, people use both internal benchmarks and some of these external ones from groups that have published their results to verify results but then also to evaluate perhaps our improvements on what was published. For instance I think there was a paper that I read about rare diseases and evaluating the relatedness of different rare diseases within the context of their treatability. They actually had their graph published online that I could download, put into Neo4j, spin it up and then you can try to reproduce their findings. The disturbing part of the reproducibility crisis is that we can’t always reproduce what was published in a paper, but at least we can look at the benchmarks that they looked at for our own methods. This problem is a lot more complex with large language models because they don’t have a standardized input. When we take a look at the temperature setting with GPT, you can always change how chaotic the expected result would be.
Ross Katz: That makes a lot of sense. This knowledge graph problem is really fascinating and also something that I think has a lot of applicability both inside of the biotech world and outside of the biotech world. I’m curious, what are some of your biggest lessons learned from going on this journey of building and maintaining this knowledge graph and the diverse end user outputs that you’re delivering?
Cody Schiffer: I think one of the biggest lessons is one we recently learned, which is again going back to how we convey this material. If I looked at this graph, I’ve been working with it for so long that’s okay, I understand what’s being represented here. It was clear from one of our first meetings that that is not easily conveyed information. Coming up with a way to convey the knowledge graph intelligently for end users but also to allow them to interact with the graph that allows them to learn how to use it is just as important. That was probably a big primary lesson and one of the primary drivers for this front end that we put together that allows people to curate things, that allows people to explore it.
Ross Katz: I would love, because we only touched on it briefly, can you give a sense of what are the key components of the front end that you build and how you think the components enable your end users to interact effectively with the graph?
Cody Schiffer: I can’t take too much credit for this. This was one of the engineers, Ankur, who’s been great to work with. He really took some great initiative and piloted developing this front end after we identified that it would be useful. We had multiple iterations of it, but key components are the ability to sort graph nodes by type or certain properties. There’s also the ability to reorganize edges and nodes hierarchically. Now this sounds really boring, but we have found it to be really important. We also have the ability to use large language models to generate Neo4j Cypher commands for people so that they can actually execute their own queries from free language. One of the use cases for this knowledge graph that I haven’t mentioned has been developing a chatbot which can similar to a RAG method, ask questions to the knowledge graph using the knowledge graph as context, a frozen version of it, and then spit out an answer from this free text asked to it. We also have the ability to execute simple topological graph analyses like shortest path algorithms and we are working on leveraging more advanced deep learning methods and putting them there, allowing access to executing them. We hope to do that in the future. And then again there is the curation and annotation component.
Ross Katz: What are the types of natural language queries that you see people making of the graph? What’s a typical question that someone would ask of the graph in order to query it?
Cody Schiffer: A lot of them are fairly high level and they result in graph queries that are effectively show me the entire graph. But sometimes people are saying show me all proteins within three hops of this disease and then make sure it considers another protein within the context. So it has to be linked by another protein. Another probably better example is people ask what is the shortest path between a disease or a company and another company, but it must have a disease that relates them or a drug. So we understand what’s the network of connections of companies that have either collaborated or potentially competing on a certain disease.
Ross Katz: It’s so fascinating and so many questions that I can imagine stakeholders would want to ask, but I could also just imagine the nightmare of performance considerations you have to think about when someone is potentially querying your entire graph using natural language.
Cody Schiffer: Which is why we are using the graph for analysis, but since the process is still in its infancy and we are still expanding our graph, we are always collaborating hand in hand with clinicians to better understand how to use the graph but also to make sure that it’s working appropriately. That makes sense for an early product. One challenge that also came up was when’s the best point to freeze the graph? Cause technically the graph is always expanding because we have structured data sources that refresh and then we have unstructured data sources which we refresh every 15 minutes. Asking the question of when is the appropriate time to actually run an analysis can be difficult and going back to the reproducibility thing, running an analysis on a graph today is very different than running the analysis a month ago. The AbbVie and Cerevel deal happened yesterday. So that wouldn’t even be reflected in the novel relationships between AbbVie and the suite of I think it’s neurological disorders and also psychiatric disorders that Cerevel looks at, there’s a whole new branch of relationships there, just from that press release alone. We are still working on a method that allows us to better understand how the graph changes and how that affects our results, but for now what we do is we freeze the graph and we have similar to that benchmark that we discussed earlier a graph benchmark that allows us to compare our analyses across different timelines. I suspect that we will have to come up with a more robust method for measuring performance across the graph, but I have not thought of that yet.
Ross Katz: I can imagine that there’s almost never a situation where you would want to roll the graph back because you don’t want to omit the information that has come about since the last graph was constructed, but obviously people when they run an analysis want the results to be a superset of the results you got yesterday. I can imagine there are just all sorts of challenging efforts around that. As we start to bring this conversation toward a close, I’ve just got a few quick questions to wrap up with. One is that I imagine there is a constant stream of cloud providers and SaaS platforms and vendors that are coming to you offering new data assets and new tools to plug into the NLP efforts that you’re doing and the graph efforts that you’re doing. I’m just curious, how do you think about the build versus buy question, or do you just tune it all out and only go seeking a tool when you know it’s absolutely necessary?
Cody Schiffer: This has become something that’s much more important I’d say in the past year. I think there are a number of things to consider, head count versus primary business cases. With something like the graph or developing NLP-based pipelines, these things take time to measure their impact on the company from actually measuring the impact, but they also take time to construct. I don’t make a lot of these decisions at the end of the day. I provide my input to my manager, and we both will scout out many members of the team. Similar to how we scout out stakeholders, we’ll also scout out potential vendors that are of interest. We have had some collaboration with external vendors, but a lot of our stuff is done internally. I’m actually undecided if the future looks like people buy more of these vendors versus do more internal development. I’m not actually sure which way it’ll go yet.
Ross Katz: Interesting. Another thing that interests me about your background is that you come with both the biology and scientific background, but you also bring the data science and machine learning side, so you are well equipped to bridge the gap between all of these domain experts and the data science world. But I wonder, as you think about your team, are you building a team of people that look more like you that have the biological background or how do you think about creating the right team that’s going to be able to collaborate effectively with the stakeholders you have across the organization?
Cody Schiffer: Great question. I haven’t been managing for too long, and what I have focused on is complementing my skill set and making up for things that I’m not as strong in. At the end of the day, I’m probably not the best software engineer. I probably write too many loops, it’s not very Pythonic. Thus far we’ve worked with a lot of computer scientists. But I think as we start moving more into the graph domain and start working on some questions earlier in drug discovery, the need for more either biologically literate software engineers or biologists that can code will be higher. Thus far the team that I worked with, whether they’re interns or new grads or people coming out of master’s programs are more comp sci heavy at this time. They’ve been great because they’re wizards at coding. And they’re great and I think that they also benefit from some of the skill sets that some of the team has that come from PhDs or come from research programs or come from working in a lab like I did in college. I think that the latter are better able to organize experiments and perhaps deliver results to stakeholders than some of the more comp sci focused talent initially is and I think both of those groups really complement each other and I’ve been very proud about how members of my team have really expanded their ability to not only interpret biological data or bio-oriented data more masterfully, but are also able to then communicate their findings to people on the more bio-y side more effectively than when they started. Again going back to how these teams integrate is really important.
Ross Katz: That makes a lot of sense. Just the last question before I let you go, as you look ahead toward what the future holds for your team and for NLP and for all of the tools that you’re building internally, what are the sorts of high value advancements you expect to see either in the world at large or internally that are going to really transform the way that you do business?
Cody Schiffer: I’m very much looking forward to the impact of knowledge graphs in the drug discovery process. I think there is a high area of impact for things like target selection and indication expansion, not necessarily because graphs or NLP are just going to suggest the best target to look at, but because they save clinicians and biologists in the company time. Drug development is expensive and risky and hard. I think that we’ve made a lot of great progress in the past few years as to speeding up drug discovery, and we have our first branch of AI designed drugs coming out there and I think those are great. But I think perhaps the greatest value add just comes from further de-risking drug development in particular. Whether that’s in better representing molecules as graphs or coming up with novel methods to predict molecule target binding using graph data science or perhaps better allowing business development professionals to identify licensing deals from company company interaction. I think using graphs and the NLP that supports the expansion of those graphs will really speed that up and I think anything that can speed up the development of medication is particularly important. Because right now it’s long and it’s hard and not everything goes as quickly as an mRNA vaccine. That was great and I think we need more medicine and more research here. So I’m excited for that realm in particular.
Ross Katz: Well Cody it’s been a real pleasure to talk with you. Thank you so much for your time and for all the insight and look forward to connecting down the line.
Cody Schiffer: Absolutely. Thank you for inviting me to talk today. I hope you or anyone else who listens to this is more interested in this field, because I think there are really important questions to answer and I’m excited for the future and I hope people are too.
Jason: And that’s it for this episode of Data in Biotech. If you enjoyed the episode, please subscribe, rate, or leave a review in your podcast platform of choice. See you next time.