The Maintenance Trap: Why AI-Accelerated Data Teams Feel Slower

Most data teams have never been more productive by the metrics we typically judge them on: models delivered, pipelines built, dashboards published. But most data leaders will tell you they have never felt more underwater. Both things can be true.
The 2026 dbt Labs State of Analytics Engineering report surveyed 363 practitioners and found that most of them spend most of their time maintaining or organizing what already exists, not building anything new. AI coding tools accelerate the building part, and they do it well. Unfortunately, the building part is no longer where the work lives.
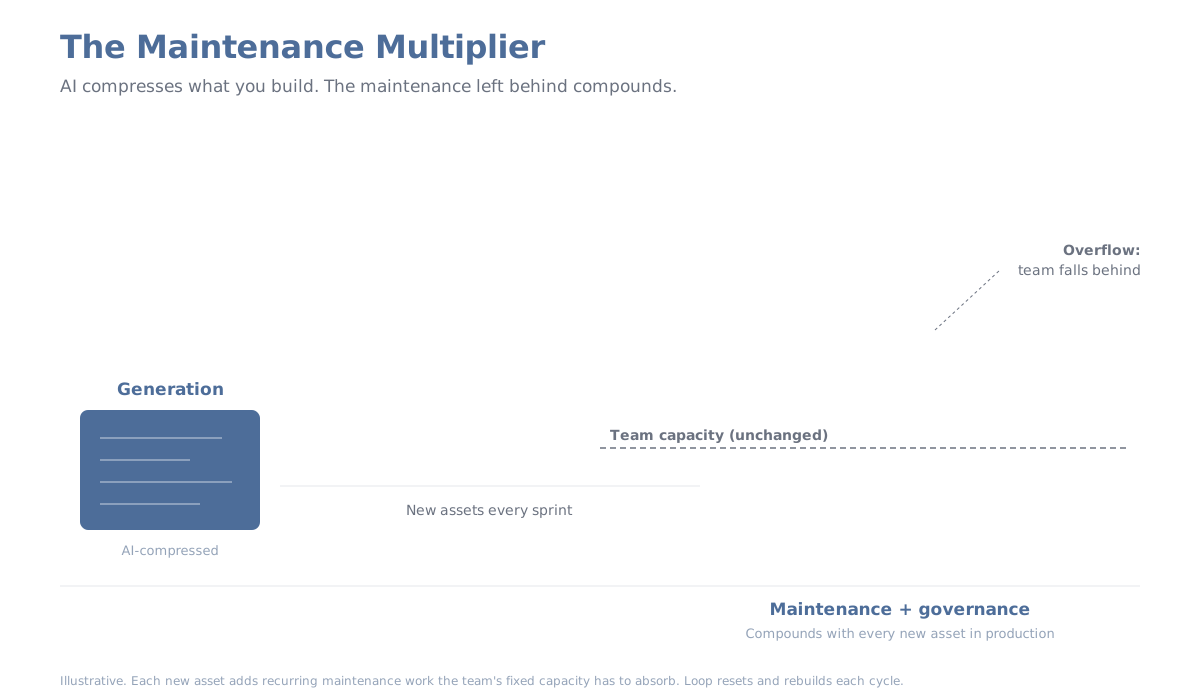
Every data asset that reaches production creates a maintenance surface that compounds over the asset’s lifetime. A dbt model, a pipeline, an internal app, a customer-facing dashboard: each one adds schema dependencies, test coverage, ownership assignments, documentation, and incident response. AI can take a four-hour build down to thirty minutes with Claude Code or a similar coding agent. It does not shorten the years of maintenance that follow. Double the rate of production without a matching investment in the work that comes after, and within a few quarters the team is producing more and falling further behind at the same time. That is the maintenance trap.
I worked through this trap with Jason Bradwell on Episode 21 of Eventual Consistency, where we examined what the dbt report reveals about the widening gap between generation speed and governance investment. What follows is the longer argument.
The math nobody runs
Most of what a data team does is not new work. The 2026 dbt report puts the ratio at roughly four to one. For every hour spent writing new code, four hours go to maintenance: refactoring when business requirements change, debugging when upstream schemas shift, decoding legacy logic, and responding to incidents.
AI coding tools are designed for the one hour, not the four. The productivity narrative around them is built almost entirely on measuring that one hour. The problem is that what they do well in that one hour creates more of what they cannot yet do in the other four.
A model that took four hours to build by hand and thirty minutes to build with Claude Code still requires the same schema dependency management, test maintenance, incident response surface, and documentation. Generation cost dropped 85%. Running cost barely moved.
So consider a team that was previously producing five new assets per sprint and is now producing ten. If each asset carries roughly the same maintenance load, and in production it does, then within two or three quarters the maintenance backlog has grown by 50 to 100 percent. The team usually has not. What follows is the predictable consequence of accelerating one layer of the work without expanding capacity in the layers underneath.
The natural objection provided by business leaders and budget owners is that AI should compress maintenance too. It can read code, trace lineage, write tests, and explain what a model does. So why doesn’t acceleration in generation translate into acceleration everywhere downstream?
Most of maintenance is not a coding problem
AI handles the local pieces of maintenance well. It will refactor a single model, write missing test coverage, or generate documentation when asked. Where it falls short is at the seams, the places where maintenance stops being a coding problem and becomes a judgment, coordination, or accountability problem.
When an upstream schema changes and three downstream models break, the fix is not just code. Someone has to assess whether the change was intentional, whether the downstream owners should adapt or the upstream team should revert, and who needs to be informed. That is a coordination problem wrapped in a political problem wrapped in a code problem, and AI does not collapse the first two.
Real maintenance is the work of understanding a complex sociotechnical system well enough to make good decisions about it. Writing code is a small part of that. AI is closing the gap on code comprehension. Judgment, coordination, and accountability remain human work, and those scale with the number of assets in production. The faster the team produces, the faster the queue of human-only work grows underneath it.
When better recovery makes a worse system
There is a second-order failure mode here, and it is one the cloud infrastructure world learned the hard way a decade ago. The premise was: if you can recover from problems fast enough, then you can tolerate more problems. The things that get measured get done:
- Test coverage rises.
- Bug counts fall.
- Mean time to recovery shortens.
- Every dashboard pointed at the system reports it is healthier than it has ever been.
But the system itself is not healthier. The rate of change has outrun the rate at which anyone can build a mental model of what changed. Mitchell Hashimoto, who lived through this in the cloud transition, has a phrase for the result: an automated, resilient catastrophe machine. The recovery metrics look pristine, but the interactions inside the system become inscrutable.
In data, silent compounding decay looks like this:
- A schema change ripples through five models that nobody traced, and the failures appear in places no one can connect back to the change.
- Concurrent agent queries contend with the reporting jobs that run the business, and no monitor flags the interference.
- A metric definition drifts across three downstream products because each team adopted a slightly different variant, and the divergence only surfaces when two boards see different numbers for the same KPI.
Tests on each individual asset pass, but the interactions between them are where the risk lives, and data tests typically do not cover those.
The 2026 dbt report shows this dynamic at scale: 72% of teams have adopted AI-assisted coding, while only 24% have invested in AI for governance. I wouldn’t classify that as an investment gap; I would classify it as a capabilities gap. That gap demonstrates how acceleration outruns the systems that keep generation coherent.
Catching this kind of decay requires sustained attention to how the whole system fits together, not to work on any single asset. AI can apply enormous effort to one task at one moment. It cannot yet apply simultaneous attention to twenty interacting surfaces that evolve over weeks. That kind of attention is human work, and it does not scale by adding more agents.
Compute scales. Attention does not.
More agents, more dashboards, and more queries lead to a higher warehouse bill. The 2026 dbt report puts the figure at 57% of teams reporting increased warehouse and compute spend. The harder number to look at is that only 36% report increased budgets for the people maintaining the systems generating that spend. The work that comes with the additional spend has to fit somewhere.
You can double a warehouse in sixty seconds, but you cannot double a data team’s attention in sixty days. Hiring takes months, and onboarding takes longer, because a new engineer has to absorb the system before they can add value. By the time attention has expanded to match the work, the work has moved on.
Here is what happens to a data team’s attention when AI tools arrive in an organization that also gives stakeholders access to conversational data interfaces:
- More assets reach production faster. Each one requires monitoring, maintenance, and incident response. The ten assets that used to take a sprint now take a week, but they carry roughly the same ongoing support load as before.
- Demand becomes invisible. Stakeholders who used to file tickets now ask agents directly. The visible queue disappears, but the team does not get fewer requests; it stops being able to see them coming. The work resurfaces later as warehouse contention, governance gaps, and incidents whose origins have to be reverse-engineered.
- Unplanned query load hits the warehouse. Vibe-coded apps, agent queries, and one-off integrations consume capacity the team did not size for. Whoever pays the warehouse bill, the data team fields the consequences. Queries compete for capacity. SLAs slip. The architecture absorbs concurrent load it was not sized for.
- The governance surface expands at the same time. Every new data product needs access controls, ownership assignment, and documentation. These obligations were already underinvested before AI; the increased production rate multiplies them.
The compounding tax shows up in three places at once.
- In operations, the team becomes a firefighting unit for failures whose root causes span multiple assets. Incident response slows because each failure requires reconstructing context from scratch. Schema migrations get more cautious because the downstream blast radius is no longer knowable from any single dashboard.
- In people, senior engineers leave because the work has become an endless triage of interactions they did not introduce and cannot fully see. The cause is the loss of conditions under which the work used to be satisfying: owning a clean piece of the system, building something that stays clean and compounds value, predicting how a change will play out.
- In budget conversations, executives see double-digit output gains and cannot understand why the team needs more people. The unstated assumption in most AI productivity narratives is that one agent equals many engineers. The piece that does not get spoken out loud is that agents can do tasks at high speed but cannot hold a system together. That work still requires people, and the number of surfaces that need holding together is growing faster than agents can offset.
AI does not primarily increase data volume, which is what most warehouse cost monitoring tracks. It increases concurrency (more agents querying the warehouse in parallel) and complexity (more redundant transformations cluttering the dependency graph). Those are the drivers AI affects most, and the ones standard monitoring is least likely to surface. If your warehouse bill is rising and you have already optimized ingestion, that is where to look.
Not every team has this problem equally
Whether AI accelerates your team or buries it depends on what kind of data work your business runs on. The same tools, the same adoption rate, and the same generation speedup produce opposite results across companies, and the reason is the demand mix.
Data team work happens in four layers:
- Generation: writing new code, models, queries, and transformations.
- Integration: moving data between systems, handling schema evolution, and enforcing contracts.
- Maintenance: refactoring existing assets, debugging failures, and decoding legacy logic.
- Governance: testing, lineage, ownership, access control, and observability.
Most of what AI does well sits in generation, with some help in integration. Almost nothing in maintenance and governance.
That work serves four kinds of demand. The four are not perfectly disjoint, but they capture how lifecycle cost distributes across the layers:
- Operational reporting: daily dashboards, KPI tracking, and recurring reports leadership and operators use to run the business. Most of the lifecycle cost is in maintenance and governance because correctness has to be defended continuously and time-to-detection on errors is short. Generation is a small slice.
- Exploratory analysis: ad hoc questions, hypothesis testing, and one-off investigations. Almost all the work is generation. A first-pass answer that is roughly right beats a slow answer that is exactly right. The assets are usually disposable. Maintenance burden per asset is near zero.
- Decision support: specific, high-stakes analyses behind marketing mix, pricing changes, market entry, headcount planning, or capital allocation. Bounded work product, high consequence, often re-run as inputs change. Every layer carries meaningful weight, and every error has business consequences.
- Embedded analytics: data feeding products, customer-facing dashboards, or downstream applications. SLA is external, bugs become customer-visible issues, and the asset has to be maintained indefinitely because it is part of the product. Maintenance and governance dominate the lifecycle cost. Generation is the smallest slice.
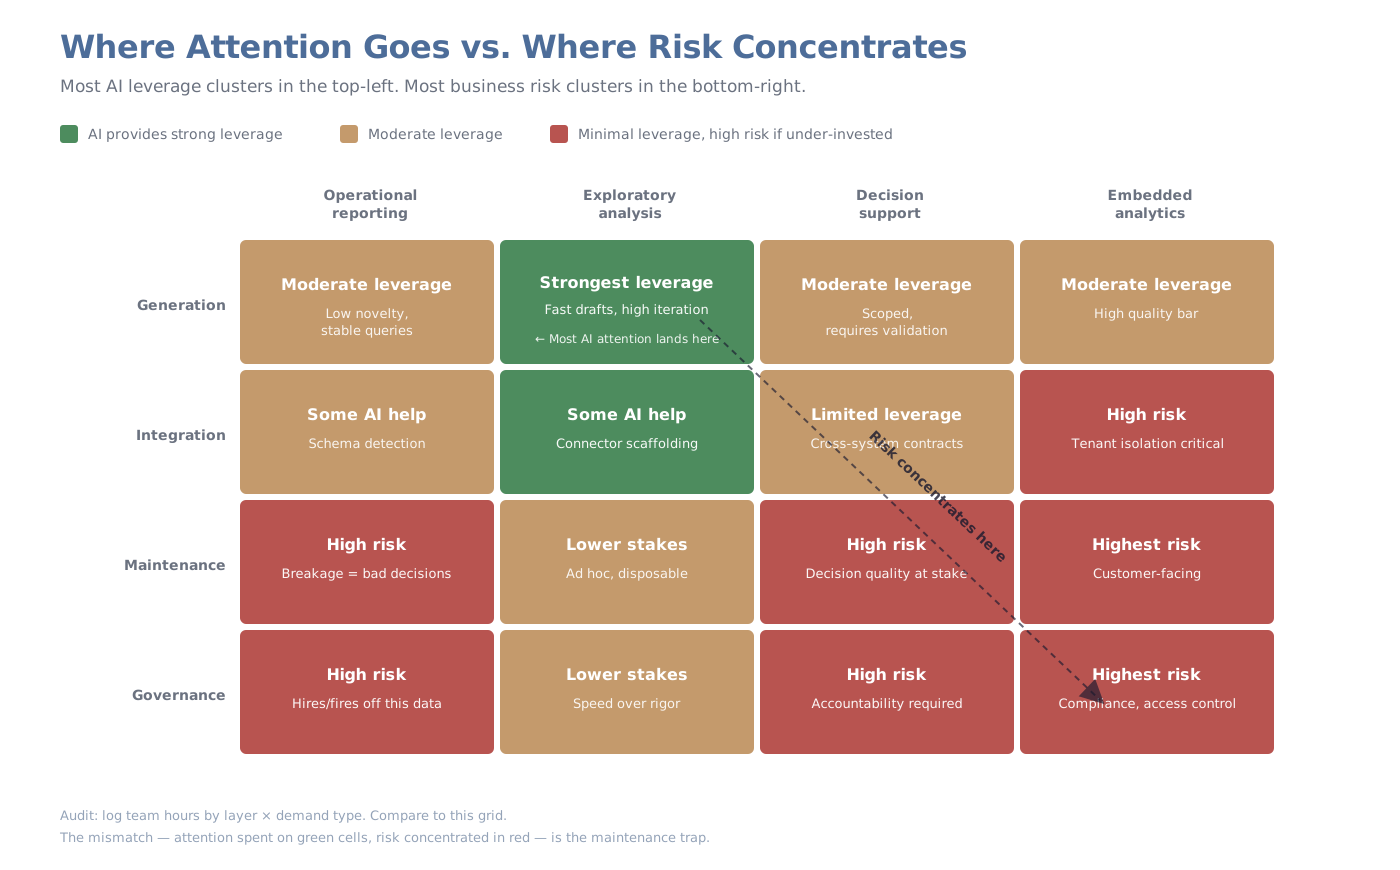
AI leverage concentrates in the top-left of the grid: generation under exploratory analysis. Business risk and lifecycle cost concentrate in the bottom-right: maintenance and governance under operational reporting and embedded analytics.
That mismatch determines whether AI ultimately speeds up or slows down your pre-existing team. If your business runs primarily on exploratory analysis, generation is the work, generation is what AI accelerates, the assets are disposable, and maintenance burden per asset is limited. AI creates extensive leverage.
If your business runs primarily on operational reporting and embedded analytics, your throughput slows per person as AI accelerates. Generation is the smallest layer. Maintenance and governance carry both the cost and the risk. Without a matching investment in the layers AI does not accelerate, the math breaks and the system starts to decay underneath the metrics.
Most teams are a mix. The question is what proportion of business value flows through which demand types. The same AI tools that are pure leverage in an exploratory shop are a slow-motion failure in a product analytics shop. The first question is which zone of the grid your business runs in, and what that implies about where you need to invest before AI acceleration becomes a net detriment.
What changes
Closing the gap requires four shifts.
- Match generation throughput to attention capacity. If AI doubled your generation throughput this year, the binding constraint on your operating model is no longer “how fast can we build.” It is how many new assets the team’s attention can hold as a coherent whole. That number does not double when generation does. Deliver three well-governed assets a sprint instead of five ungoverned ones. The lifecycle cost calculation rewards the conservative-looking number.
- Measure system health globally, not by local proxies. Test coverage rising and bug reports falling describe individual assets. The team also needs a view of how many interacting surfaces exist, how often metric definitions diverge across products, how many models share lineage with assets nobody owns, and how concurrent the warehouse load runs. Most monitoring tools track local quality and aggregate cost. They do not track interactions, which is where the decay accumulates.
- Assign ownership before production, not after an incident. The dbt report found that 41% of teams report ambiguous data ownership. That number has held above 40% in every iteration of the survey. Ownership ambiguity is a social and political problem that does not yield to better tooling. Someone has to decide whether the producing team, the pipeline team, or the consuming team is responsible for a given asset. That decision involves negotiation about accountability most organizations avoid until something breaks. AI makes the problem more visible because agents query assets that previously sat dormant. It does not make it easier to resolve.
- Budget for running the system the way platform teams do. Infrastructure organizations budget 70 to 80 percent of capacity for operations, reliability, and maintenance. Data teams have historically budgeted the inverse, with most capacity going to new development. AI has made the building part fast enough that the running part is now the dominant cost. On the podcast, I argued every data team is becoming a data platform team. This is partly why.
Done together, these shifts do not slow the team down so much as change how the team is evaluated. The output stops being a growing surface area of fragile assets and becomes a system that stays coherent as it scales.
What it adds up to
AI does what it claims to do: it compresses generation, and generation is real work that used to take real time. The mismatch is between what AI accelerates and what most businesses depend on.
If your business runs primarily on exploratory analysis, you get to capture most of the value from AI. If your business runs primarily on operational reporting and embedded analytics, accelerating generation without investing in maintenance and governance leads to a team that delivers more and falls further behind at the same time. Most teams sit between the two. The question is how much you need to invest in the layers AI does not accelerate so the layers it does accelerate do not bury you.
To know which side you are on, log the last two sprints of team hours by layer and demand type, and compare the distribution to where business value and business risk concentrate. The size of that gap tells you how aggressively to close it.
If you want to pressure-test your allocation against what we see working across our client base, our data assessment is where most of those conversations start. If you already know the gap and need capacity to close it, a managed data team is the faster path.