




Blog
MCP in the Enterprise: Cost, Security, and Workload Routing
MCP is now core infrastructure. Its real cost at enterprise scale, where the security model breaks, and how to route agent workloads deliberately.
By Ross KatzRead

Grafana turns time-series data into operational decisions. No other visualization tool does this as well.
We deploy Grafana dashboards that give operations teams per-machine, per-process, per-minute visibility into what is happening right now.
GrafanaGrafana occupies a different category than BI tools like Tableau or Power BI. Those tools are designed for analytical dashboards that answer business questions about what happened yesterday or last quarter. Grafana is designed for operational dashboards that answer what is happening right now. If your data has a time dimension and freshness measured in seconds matters, Grafana is the purpose-built tool.
Proven approaches from real client engagements.
Real-time operational monitoring is Grafana's strongest use case, and no BI tool matches it for this purpose. For a biotech manufacturing client, we deployed Grafana dashboards that replaced SCADA's limited visibility with per-machine, per-barcode detail across 60+ IoT machines. Sensor data streams in at 5ms intervals through AWS Kinesis and Databricks, and Grafana renders it in dashboards that enable cross-machine comparison, trend analysis, and anomaly detection. The engagement has spanned years and more than 29 statements of work.
What SCADA systems show is whether a machine is currently running. What Grafana shows is how that machine's performance has trended over the last hour, how it compares to other machines on the same line, whether the current pattern resembles a pre-failure signature, and whether the current batch is tracking within quality tolerances. That difference in visibility changes the decisions operators can make.
Grafana's alerting is tightly integrated with the dashboards. You set thresholds on any metric, and alerts route to Slack, PagerDuty, email, or custom webhooks based on severity. Combined with ML failure detection models (which we build on Databricks), Grafana becomes an early warning system that catches problems before they become outages or quality escapes.
Grafana's time-series focus extends to any operational context where real-time visibility reduces response time. We use it for data pipeline monitoring (tracking pipeline health, data freshness, and processing latency), infrastructure observability (cloud resource utilization, API response times), and application performance monitoring. The data source flexibility (100+ connectors including Prometheus, InfluxDB, Elasticsearch, PostgreSQL, CloudWatch) means Grafana can aggregate monitoring data from across your stack into a single view.
An underappreciated use case is Grafana as the observability layer for your data platform itself. How long did the last dbt run take? When did the Fivetran sync last succeed? How many rows flowed through the pipeline today vs. yesterday? These operational questions about your data stack are time-series questions, and Grafana answers them better than your BI tool does.
Grafana is purpose-built for real-time operational monitoring rather than the ad hoc business analytics that tools like Tableau and Power BI specialize in. It focuses on time-series visualization and alerting rather than drag-and-drop business exploration, calculated fields for complex business logic, or a semantic modeling layer for governed self-service. If your primary need is executive dashboards that show monthly revenue trends and cohort analysis, that work belongs in a BI tool, and Grafana pairs well alongside one for the operational layer.
Grafana's dashboard-building experience is built for users with some technical comfort, which is exactly the audience it targets. Operational teams in manufacturing, DevOps, and infrastructure are right at home in it. For marketing or finance teams whose day-to-day is business reporting, a traditional BI tool is the more natural fit, and the two complement each other well.
CorrDyn services where we use Grafana.

Track production efficiency, warehouse performance, and workforce productivity with data infrastructure built for operations teams.

Turn data into decisions with BI platforms that your team will use. CorrDyn builds dashboards, reports, and analytics workflows.

Build reliable, cost-effective data pipelines on AWS, GCP, and Azure. CorrDyn designs and implements data infrastructure that scales.

Fix failing pipelines, slow queries, and unreliable data delivery. CorrDyn stabilizes your data infrastructure and keeps it running.
Real outcomes from engagements using Grafana.

Biotech / Life Sciences Manufacturing
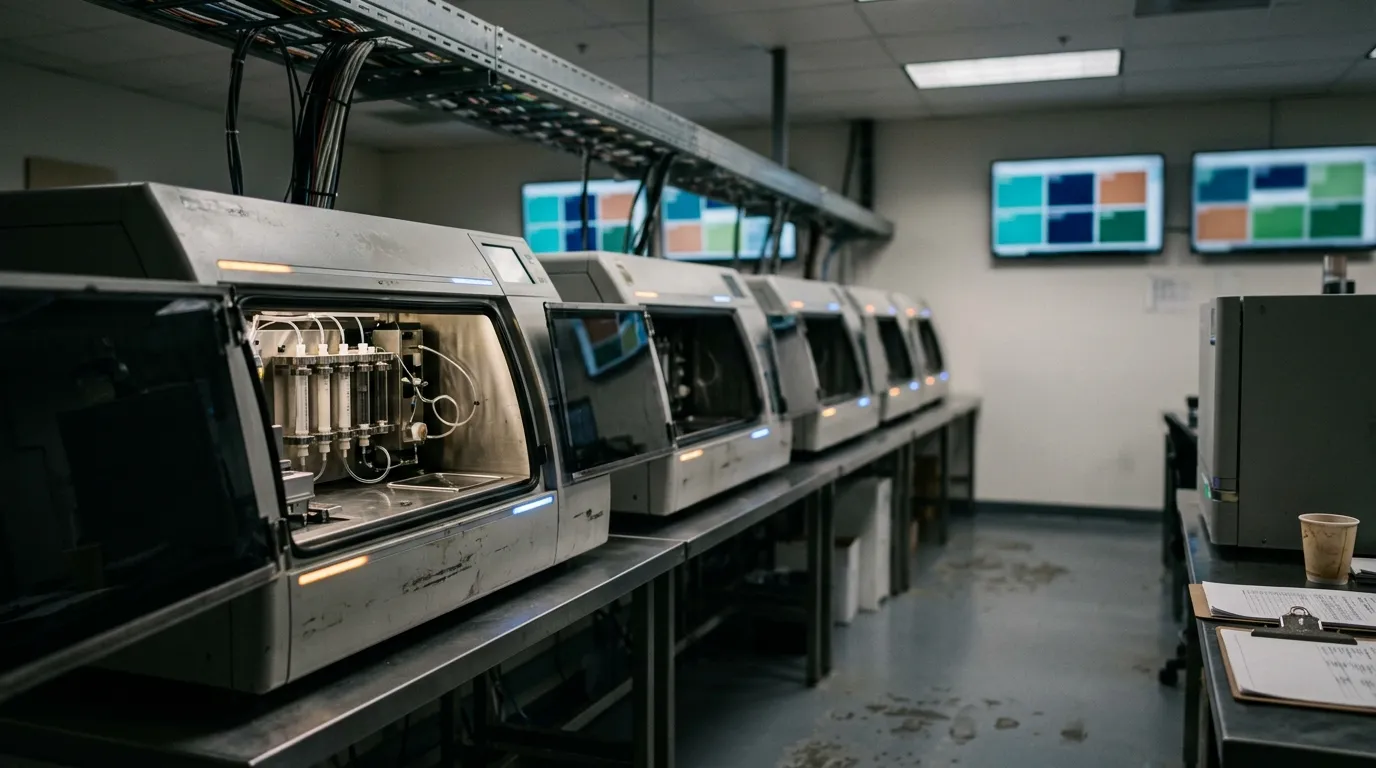
Biotech / Life Sciences Manufacturing
Technologies we commonly pair with Grafana.
MCP is now core infrastructure. Its real cost at enterprise scale, where the security model breaks, and how to route agent workloads deliberately.

AI agents querying raw source systems inherit every data quality problem the transformation layer solves — then present wrong answers with confidence.

How to decompose LLM workflows into task components, break down complex RAG systems, and select tools using 10 evaluation principles.

Why biotech data sits underutilized, why off-the-shelf solutions fall short, and how an external data team delivers quick wins under $150K.
Whether you need a new deployment, an optimization audit, or a migration plan, we will start with what you have and tell you what makes sense.
Book an Intro Call