Manufacturing Throughput Optimization for a Biotech Producer
CorrDyn built process time analytics and a batch production simulation for a biotech manufacturer, enabling data-driven throughput optimization.
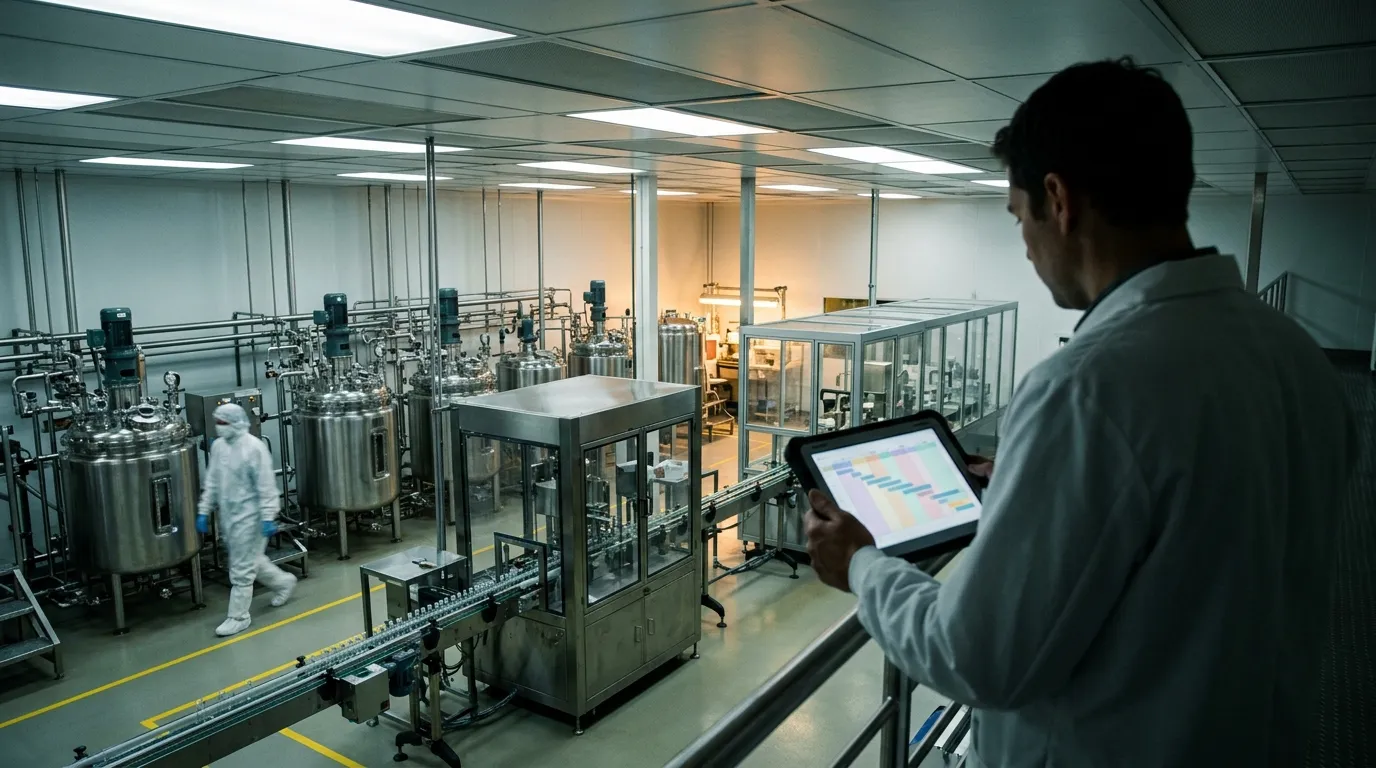
Step-level timing data surfaced across all value streams and product categories
Process visibility
Simulation of batch production configurations to maximize output per dollar
Throughput modeling
Leadership can compare process times day-over-day, week-over-week, month-over-month
Decision support
The situation
A global biotech manufacturer runs automated production lines where each batch passes through a multi-step chemical process: sequences of processing and curing operations, repeated across multiple cycles, with a final stabilization period. The process involves shared equipment that moves between production units and parallel operations that run independently, creating complex scheduling dynamics.
Production leadership needed two things. First, visibility into process times at every step of production, broken down by value stream, product category, and production phase. The existing control systems showed current machine state but could not answer questions like “how do process times for this product category compare to last month?” or “which steps are contributing most to total production time?” Second, the team wanted to understand how different equipment configurations would affect throughput. Adding production units to the line changes the blocking dynamics between sequential and parallel operations in ways that are not intuitive to reason about.
What we built
CorrDyn delivered two capabilities built on the same data engineering foundation.
Process time analytics. We built pipelines that extract step-level timing data from the manufacturing control layer into Databricks, where it is structured by value stream, product category, and process phase. Grafana dashboards let production leaders compare the distribution of process times for any step, for any product, across any time period. A production manager can now see, for example, that cycle times for a specific product category increased by 15% over the past two weeks and investigate whether the change correlates with a raw material lot, a shift change, or an equipment maintenance event.
Batch production throughput simulation. We built a simulation model that represents the physical production process as a state machine. Each production unit tracks its position in the processing cycle. Shared equipment is modeled as a constrained resource that must move between units, with movement time dependent on the physical layout. Parallel operations run independently but must complete before the next sequential step can begin on the same unit. The simulation explores configurations of unit count, layout geometry, and shared equipment allocation to find the arrangement that maximizes output per dollar of equipment and floor space.
The model captures the core scheduling challenge: with few production units, shared equipment sits idle during parallel operations. With many units, parallel operations may not complete before the equipment returns, creating blocking. The optimal configuration depends on the specific durations of each step, which vary by product type.
What changed
Production leaders now make resource allocation and process improvement decisions based on measured process time distributions rather than operator intuition. The dashboards surface bottlenecks that were previously invisible, enabling targeted interventions on the steps that most constrain throughput. The throughput simulation gives capital planning teams a quantitative basis for equipment configuration decisions, replacing back-of-the-envelope estimates with simulation results that account for the blocking dynamics of shared manufacturing resources.
Frequently Asked
Questions
Our production data is trapped in control systems — how do we use it for optimization?
How does CorrDyn approach throughput optimization for batch manufacturing?
Does CorrDyn have experience with regulated manufacturing environments like biotech?
Related Work
Similar engagements across our portfolio.
IoT Analytics for a Biotech Manufacturing Operation
CorrDyn built machine monitoring pipelines, ML failure detection, and real-time Grafana dashboards for a global biotech DNA/RNA synthesis manufacturer.
ML-Powered Failure Detection for a Diagnostics Manufacturer
CorrDyn designed data pipeline and ML model-serving infrastructure for a diagnostics manufacturer to catch cartridge failures before quality control.

ML Customer Segmentation for an Automotive Dealer Group
CorrDyn built an ML clustering pipeline on Databricks with LLM-powered profiling to segment customers across vehicle brands for a dealer group.
Related Conversations
Podcast episodes that cover the same ground.
Applying ML/AI to Drug Development with Anil Kane
with Dr. Anil Kane, Thermo Fisher Scientific
Dr. Anil Kane of Thermo Fisher Scientific discusses how AI, machine learning, and digital tools are reshaping drug development and manufacturing efficiency.
Machine Learning and Quality Control in Biotech Manufacturing
with James Winegar, CorrDyn
James Winegar, CEO of CorrDyn, on applying machine learning to quality control workflows in biotech manufacturing and unlocking operational data.
Physics, Free Energy, and Computational Drug Discovery
with Robert Abel, Schrödinger
Robert Abel of Schrödinger on why ML alone fails in 10^60 chemical space and how physics-based simulation reaches near-experimental accuracy.