






Blog
117 Key Questions for E-Commerce Leaders
117 questions e-commerce leaders should answer across finance, marketing, sales, operations, support, technology, and BI — prioritized by business impact.
By Ross KatzRead

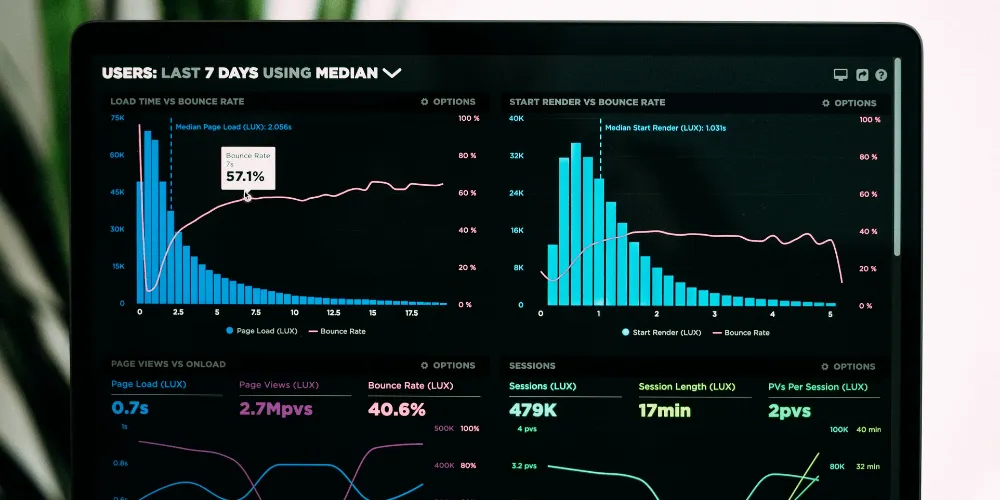
Tableau remains the best tool for visual data exploration. The dashboards are only as good as the data behind them.
We build Tableau deployments that answer the questions your stakeholders ask every morning, backed by data models they can trust.
TableauTableau's visual analytics engine is the most expressive in the market. For organizations that value deep visual exploration and analysts who want to ask questions of data without waiting for engineering, it remains the strongest choice.
Proven approaches from real client engagements.
Tableau fits organizations with skilled analysts who want self-service exploration, not just pre-built reports. The tool rewards curiosity. An analyst can start with a high-level revenue chart, drill into product categories, filter by region, and discover that one SKU in one market is driving a disproportionate share of growth. That kind of interactive exploration is where Tableau has no peer.
For a hedge fund client, we built a Tableau suite covering fund performance, operational metrics, and research output. The dashboards replaced fragmented spreadsheets and gave the portfolio management team real-time views into positions, trades, and performance attribution. The fund grew 4x over five years with only one additional hire, partly because the dashboards eliminated hours of manual reporting every week.
Tableau also handles complex visual requirements that simpler BI tools cannot: geographic analysis, statistical visualizations, multi-axis charts with independent scales, and dashboards that combine detailed tables with summary graphics. If your reporting needs include these patterns, Tableau supports them natively.
Many organizations have some version of Tableau deployed. Whether those deployments stay in daily use comes down to the data layer beneath them. The pattern is consistent: dashboards were built during an initial rollout, the person who built them left or moved on, the underlying data sources drifted, and the team lost trust. Now the dashboards exist but nobody opens them, and analysts have gone back to requesting ad hoc exports.
The root cause is almost never the tool itself. It is the data layer underneath. Tableau dashboards connected to raw, untested, inconsistently modeled data produce numbers that do not match between views. An executive sees one revenue figure on one dashboard and a different figure on another, concludes the data is unreliable, and stops using both.
For an online university, we built Tableau dashboards for 18 department heads after first building the underlying data model from six disparate sources with dbt. The data model was tested and documented before a single dashboard was created. Annual revenue grew 87% during the engagement, partly because the dashboards gave department heads self-service access to trustworthy enrollment, revenue, and marketing data.
Tableau continues to evolve as part of Salesforce, with ongoing investment in its cloud offering (Tableau Cloud) alongside the established Tableau Server. The broader market has expanded too: tools like Omni offer governed semantic layers with native dbt integration and AI-assisted analytics, and Tableau is adding capabilities in the same direction.
For organizations evaluating BI tools today: Tableau is the strongest choice for teams with skilled analysts who value visual exploration. Looker is stronger for teams on GCP that want governed self-service. Power BI is the pragmatic choice for cost-conscious Microsoft environments. Omni is the strongest option for dbt-centric teams that want AI-powered analytics grounded in a semantic layer. Tableau and Power BI are close to feature parity for most reporting use cases, with each playing to the strengths of its surrounding stack.
CorrDyn services where we use Tableau.

Turn data into decisions with BI platforms that your team will use. CorrDyn builds dashboards, reports, and analytics workflows.

Connect marketing spend to revenue. CorrDyn builds attribution models, customer segmentation, marketing mix models, and ROI reporting across channels.

Track production efficiency, warehouse performance, and workforce productivity with data infrastructure built for operations teams.

Get a full data team without the hiring timeline. CorrDyn embeds the specific skill sets you need and owns outcomes, not just hours.
Real outcomes from engagements using Tableau.

Healthcare / Home Care Services

Professional Sports

Healthcare
117 questions e-commerce leaders should answer across finance, marketing, sales, operations, support, technology, and BI — prioritized by business impact.
How data availability, actionability, and credibility determine whether your organization captures value from its data investments.
Whether you need a new deployment, an optimization audit, or a migration plan, we will start with what you have and tell you what makes sense.
Book an Intro Call